
When it comes to maths, graphing is where I draw the line1!
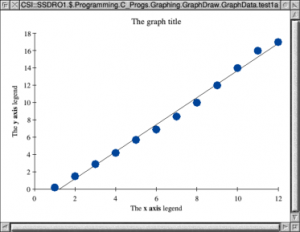
![]() GraphDraw is a graph plotting application from Chris Johnson, which allows x and y values to be input and subsequently edited, and from the resulting data the software can calculate and plot:
GraphDraw is a graph plotting application from Chris Johnson, which allows x and y values to be input and subsequently edited, and from the resulting data the software can calculate and plot:
- Lines of best fit,
- Parabolas of best fit,
- Cubic spline curves,
- Polynomials of order up to six.
Many aspects of the graphs are editable – such as legends, axes, line widths and more – and the resulting graphs can be saved as Drawfiles for printing, or importing into other applications, and they can also be exported as a MultiPlot file, using which several graphs can be combined.
The application was previously written in BASIC, but version 3.00 is the result of a complete rewrite in C. Chris says that most of the features have been retained, but one significant change is that the software can now have multiple datasets active at the same time, and their sizes are fully dynamic, which means there is no restriction on the size of dataset in use.
GraphDraw can be obtained in a number of ways:
- It can be downloaded directly from its page on Chris’ website [mirror],
- It should be available in PlingStore,
- If you are using a package manager such as PackMan, it is available from the RISC OS Open repository.
!ReadMe
- Joke blatantly stolen – and necessarily shortened – from here.